Artificial Intelligence
How LLMs Choose the Next Token: A Practical Guide to Logits, Decoding, and Sampling
An intuition-first guide to how large language models turn raw logits into next-token choices, using real-world analogies to explain temperature, top-k, and top-p.
Khalid Rizvi · January 2026 · 12 min

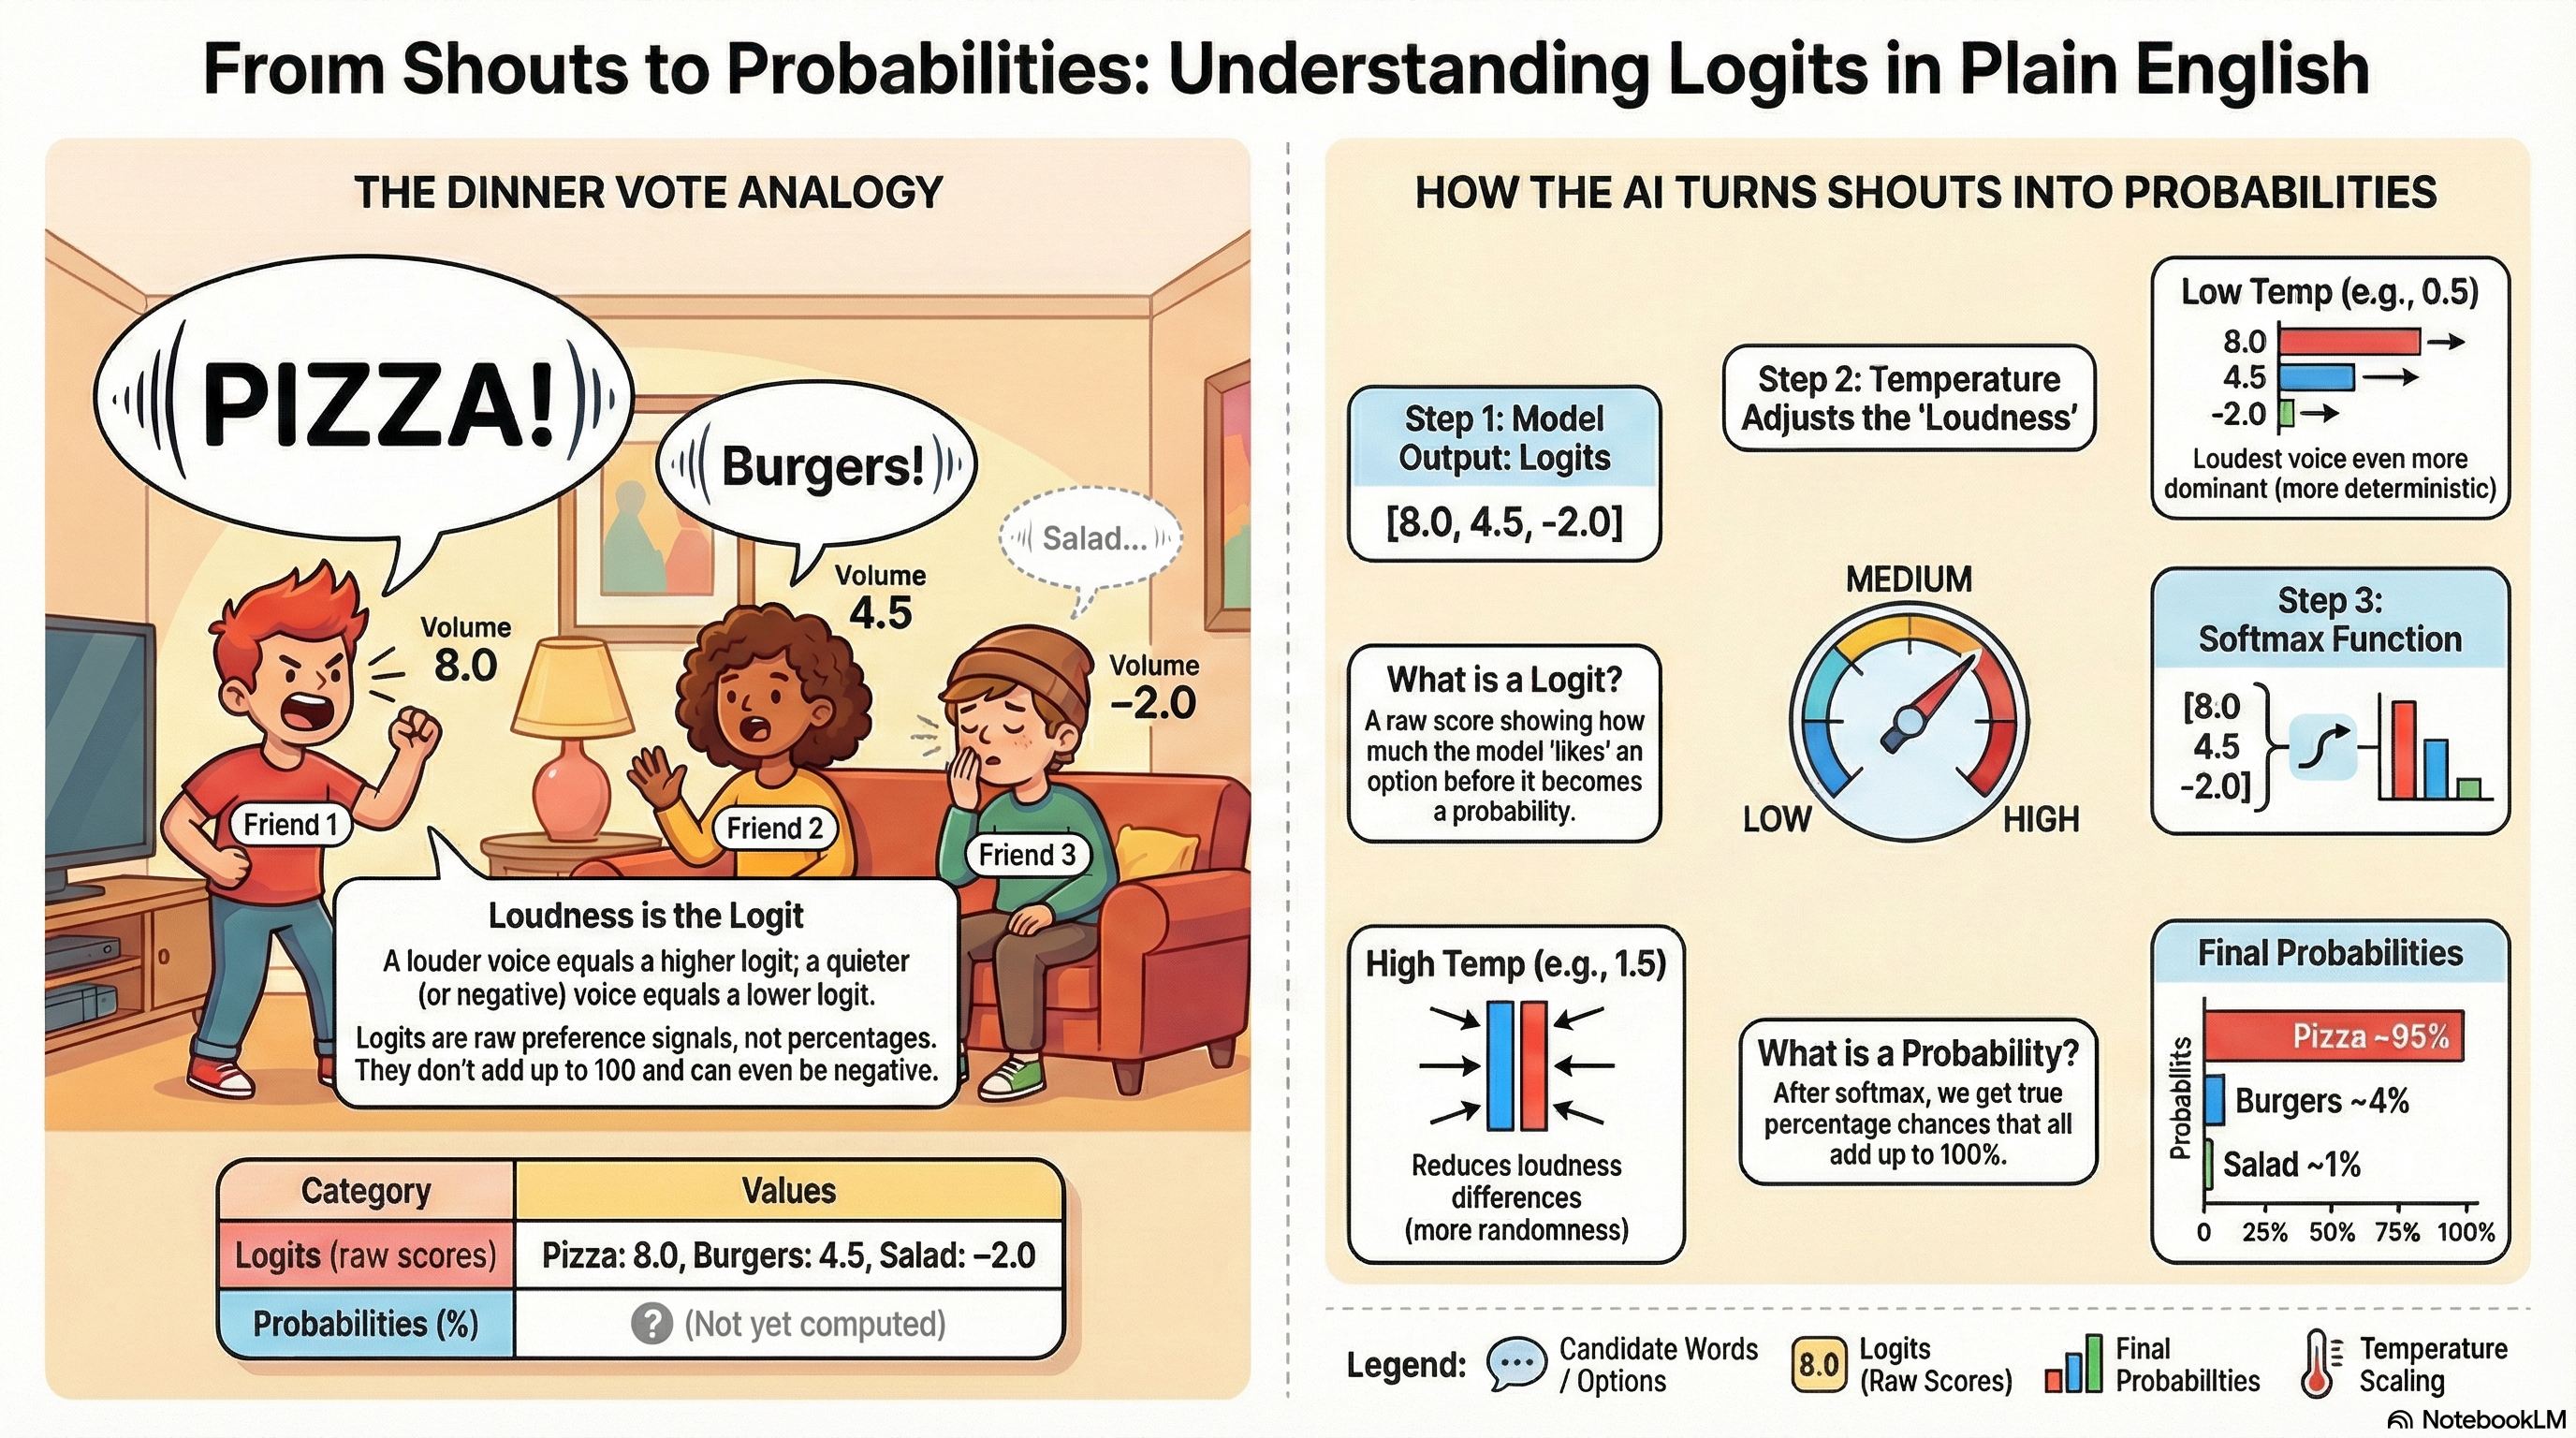
When a language model is choosing the next word, it does not start with clean percentages. Instead, it starts with something much rougher: logits, which you can think of as raw preference scores. The image uses a simple “dinner vote” scene to make this concrete. Three friends are in a living room, each calling out what they want to eat. One friend yells “PIZZA!” at the top of their lungs, another friend calls for “Burgers!” at a normal volume, and a third quietly suggests “Salad…” almost under their breath. Underneath each person is a number: 8.0 for pizza, 4.5 for burgers, and –2.0 for salad. Those numbers are the logits. They are not probabilities, they don’t add up to 100, and they can even be negative. They are simply a measure of how strongly the model “likes” each option before any normalization happens, just like loudness is a rough signal of how much each friend wants their choice.
The key idea is that loudness is the logit. A louder voice corresponds to a higher logit, and a quieter or negative voice corresponds to a lower logit. At this stage, the model has only produced raw scores for every possible token in its vocabulary. In the diagram, this is summarized in the small table at the bottom of the left panel: under “Logits (raw scores)” you see Pizza: 8.0, Burgers: 4.5, Salad: –2.0, while the “Probabilities (%)” row is still marked as “not yet computed.” This separation matters because many of the decoding tricks we use—like temperature scaling—operate on logits before they ever become probabilities. If you picture the model as a room full of people shouting different words with different volumes, logits are just the volume levels attached to each shout.
The right side of the image zooms into how the AI turns those shouts into actual probabilities. At the top, a box labeled “Step 1: Model Output: Logits” simply repeats the raw scores [8.0, 4.5, –2.0]. This is the direct output of the model’s last layer. Below that, another panel answers the question “What is a Logit?” by describing it as a raw score showing how much the model “likes” an option before it becomes a probability. The important thing is that every token the model could possibly emit gets one of these scores, not just the three we see in the example. The figure focuses on three for clarity, but in reality there are thousands or tens of thousands of logits for each decoding step.
Temperature enters as a control on these raw scores, not on the final probabilities. The diagram shows this with a thermometer icon and two small examples labeled “Low Temp (e.g., 0.5)” and “High Temp (e.g., 1.5).” With low temperature, the scores are divided by a small number, which makes the highest logit stand out even more relative to the others. In the dinner analogy, this is like turning up the sensitivity of your ears so that the loudest voice dominates the room. The loud friend shouting “PIZZA!” becomes overwhelmingly convincing, and the model will choose pizza almost every time. With high temperature, the scores are divided by a larger number, compressing differences between them. Now even quieter voices become competitive. The figure summarizes this by saying low temperature makes the loudest voice more dominant and more deterministic, while high temperature reduces loudness differences and increases randomness in the final choice.
Once logits have optionally been adjusted by temperature, the model still needs to turn them into real probabilities. This is where the softmax function comes in, which the diagram labels as “Step 3: Softmax Function.” The softmax takes the adjusted logits and converts them into a probability distribution where all values are positive and sum to one. On the right, this is visualized as a bar chart of final probabilities: pizza with a tall bar around 95%, burgers with a much shorter bar around 4%, and salad barely visible at roughly 1%. In words, after softmax, the system can now say, “Given what everyone shouted and how we scaled their loudness, there is a 95% chance we pick pizza, a 4% chance we pick burgers, and a 1% chance we pick salad.”
The image closes the loop by contrasting “What is a Logit?” with “What is a Probability?” A logit is described as the raw, pre‑softmax score. It is the internal signal the model produces for each token before any normalization. A probability is what you get after softmax: a clean percentage chance assigned to each token, suitable for sampling or for choosing the single most likely option. The legend at the bottom reinforces this mapping: speech bubbles for candidate words, small circles with numbers for logits, bars for final probabilities, and a temperature icon to show where scaling happens. If you keep that picture in mind—a room of friends shouting options with different loudness, a dial that changes how much we care about loudness differences, and a final step that turns those loudness levels into percentages—then the distinction between logits and probabilities, and the role of temperature, becomes much easier to reason about when you are tuning or debugging LLM decoding.